Goals
This training aims to develop core AI knowledge by leveraging Python's toolset, focusing on conversational English and using an adapted Agile methodology called JACI - Just, Autodidact, Collaborative and Intense. We'll be studying Python first, going through the basics and the necessary toolset in order to prepare for the AI course.
Planning
- Sprint Planning - Presentation [1]
- Start day: 30/10/2023
- End day 10/03/2024
- Hours of dedication: 2hours a day
- Task Repository [2]
Agile Methodology
- We will modify the Agile methodology to enhance the management of our training. In this scenario, we will incorporate sprints to determine the specific topics we will be studying over a two-week period. Alongside the sprints, we will conduct Daily meetings once a week to facilitate efficient communication among team members, ensure progress updates, identify potential obstacles, and foster collaboration. Along this we still have a Sprint Planning that is a meeting with all the members that defines which chapter will fit in which sprint. At the end of each sprint, we will do a review for evaluations and revisions of the work sequence.
- Scrum:
- Scrum Master: Clara Conhalato Simão
- Sprints: two-week period
- Daily: once a week
- Sprint Planning: defines which chapter will fit in which sprint
- Python course calendar

- IA course calendar

J.A.C.I. Method
- Meanig:
- Just: Adapts to the level of each participant.
- Autodidact: Material for reading and use the chat group to debate
- Collaborative: The main goal of this project is to help each other learn more about programming by sharing your knowledge.
- Intense: Since day one the students have exercises and a final project.
Material
- First Sprint
- Exercises:
- Get the dimensions of the following data (both links direct to the same archive) [5] [6]
- Using the previousdata_citrus dataset, for both oranges and grapefruits, create an array for their weight (column 0) and another one for their diameter (column 1). Oranges range up to row 4999 and grapefruits start at row 5000.
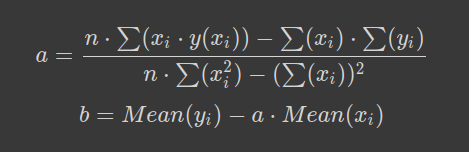
- For each of the previous oranges_weight and grapefruits_weight arrays, calculate the equation for a line that best fits each one and plot the line.Use:
- For each of the previous oranges_weight and grapefruits_weight arrays, find the slope using random numbers. Assume that b = 100.

- Second Sprint
- Curso Online Pandas: conhecendo a biblioteca | Alura [7]
- Pandas I/O: trabalhando com diferentes formatos de arquivos| Alura [8]
- Curso de Python para Análise de Dados - Do Zero ao Avançado | Youtube | Aulas 11-01 e 11-02 [9]
- Curso de Pandas - Python (Aula 0.1) - Abrindo arquivos em CSV | Youtube [10]
- Curso de Pandas - Python (Aula 0.2) - Abrindo arquivos de Excel | Youtube [11]
- Convertendo arquivos JSON para Dataframes Pandas - 03JAN2023| Youtube [12]
- Raspagem de dados de tabelas HTML com Pandas | Dica de Pandas #13 | Youtube [13]
- Exercises -Getting started with Pandas:
- Import the following file[14]
- Store the file's content in a Pandas DataFrame.
- View the DataFrame's first 7 rows and the last 5 rows.
- Check the row and column count of the DataFrame.
- Explore the columns and analyze the data type of each one.
- Extra: calculate some basic statistics for the data (mean, standard deviation, etc). Tip: search for the describe method.
- Using apartments.csv:
- Calculate the average of bedrooms per apartment
- How many neighborhoods are there in the dataset?
- Which neighborhoods have the highest average rent prices?
- Create a horizontal bar plot presenting the 5 neighborhoods with the highest average rent prices.
- Using this dataset, do the following Arquivo:Apartaments.xlsx [15]
- Check the dataset for null values, and if there any, clean the data as you wish.
- Students "Alice" and "Carlos" are not part of the class anymore. Remove them from the dataset.
- Apply a filter to select only those who were approved.
- Save the DataFrame containing only those approved in a CSV file called approved_students.csv.
- Extra: Students who scored 7.0, in fact, had an extra point that wasn't accounted for. Replace all 7.0 scores for an 8.0 score. Tip: search for the replace method.
- Using this dataset, do the following (both links direct to the same archive) [16] [17]
- The students did an extracurricular activity and won extra points. These extra points are equal to 40% of the current student score. Create a column named
- Extra_points" containing the extra points of each student, that is, 40% of their current score.
- Create one more column named "Final_score" containing the score of each student added to their extra points.
- As there were extra points given, some students that weren't approved earlier may have been approved now. Based on that, create a column called "Now_approved" with the following values:
- True: if the student was approved (final score must be greater than or equal to 6)
- False: if the student failed the class (final score must be lower than 6)
- Select students that weren't approved earlier but made it after the extra points
Team
- Clara Conhalato Simão
- Marcus Vinícius Torres Silva
- Ingrid Lima Cro Rossi
- Gabriel Carneiro Marques Amado
- Amanda Varnier Massarioli de Oliveira
- Guilherme Almeida Andrade
- Gessyca Carneiro Bernardes
- Vinícius Araujo
- Ana Lídia Costa Nunes
- Lucas Farias Nogueira
- Gustavo Almeida Santos
- Pedro Afonso Silva
- Vitor Hugo Vasconcelos de Melo
- Pedro Henrique Afonso
- Eduardo Rosa Afonso
- Pedro Henrique Bohling Peres
- Thiago Eichenberger
- Gabriella Sousa Queiroz
- Rafael Gil Nascimento
Python
Studying Python as a programming language is often recommended for various reasons. Python is known for its simple and readable syntax, making it accessible to beginners and reducing the learning curve. Additionally, it is a versatile language used in various applications such as web development, data analysis, machine learning, and automation. It is also cross-platform and in high demand in the job market, opening doors to various opportunities.
The Python developer community is known for being welcoming and friendly, facilitating collaboration on open-source projects. There is an abundance of learning resources available, including free tutorials, online courses, and books. Moreover, Python is well-suited for rapid prototyping, allowing for the quick testing of concepts and the development of solutions with agility. However, the choice of a programming language should always be guided by the specific goals of each individual's project or programming career.
AI with Data Science
- Data science uses AI (and its subset, Machine Learning) to interpret historical data, recognize patterns, and make predictions. In this case, AI and Machine Learning assist data scientists in gathering data in the form of insights.
- As mentioned, Machine Learning is a branch of AI, advancing data science to the next level of automation. Machine Learning algorithms are trained on data provided by data science to become smarter and more informed when making predictions. Therefore, Machine Learning algorithms rely on data, as they won't learn without using them as a training set.
Team in charge
- Gessyca Carneiro Bernardes(AI instructor)
- Gabriel Carneiro Marques Amado (Python instructor)
- Clara Conhalato Simão (English instructor)